
To get back into the blogging habit, I thought I’d rummage through some of my earlier posts to see if there might be something I could recycle. (How does the saying go? Good designers copy, great designers steal?) Because the topic of documentation metrics came up recently at work, I thought I’d start there and see if I had said anything about that before.
It turns out, I’d written a post or two on the subject, so let the theft recycling commence!
In The answer is Google Analytics—what was the question? I talk about how the web interaction model that Google Analytics (GA) is optimized for comes up short for a lot of user assistance content. True confession: GA is wired up to this site, and in Google Analytics just makes me sad, I followed up with a summary about how that works for me. Hint: the title sort of gives that away.
The premise of conflicting models came from a paper that my Ph.D. advisor and I wrote about the challenges of collecting useful data about your non-funnel-oriented web content. I posted a blogified version of the published paper in the series on Readers goals. Basically, if the reader’s reason for reading an article is to accomplish a goal that’s outside of the documentation, it’ll be difficult to measure how the documentation helped that goal from inside of the documentation.
I was on a roll, four years ago, because, I continued with Measuring your technical content – Part 1, Part 2, and Part 3. Part 1 talks about asking the questions you want your analytics and analysis to answer and the instrumentation that can help make that happen. Parts 2 & 3 bring this exercise into a sharper focus by trying it out on getting started topics and tutorials, respectively. That thread addresses some of the challenges that you might encounter along the way in Measuring your technical content – What about…?
In some related posts, I gave a presentation about this for a Write The Docs group in Colorado that’s summarized in Measuring Value for WriteTheDocs Boulder. Rereading that post after about four years, I see why people were a little confused by it. I covered way too much, too lightly, and too quickly. While I think my heart might have been in the right place, I really should have focused that into something more like Measuring your technical content Part 2, and Part 3. Nevertheless, that post still closed with some words of wisdom that also work for closing out this post.
Remember, this is a cycle… If you don’t get it on this one, you’ll get it on the next one. If you’re just getting started, don’t expect it to be perfect after the first iteration.
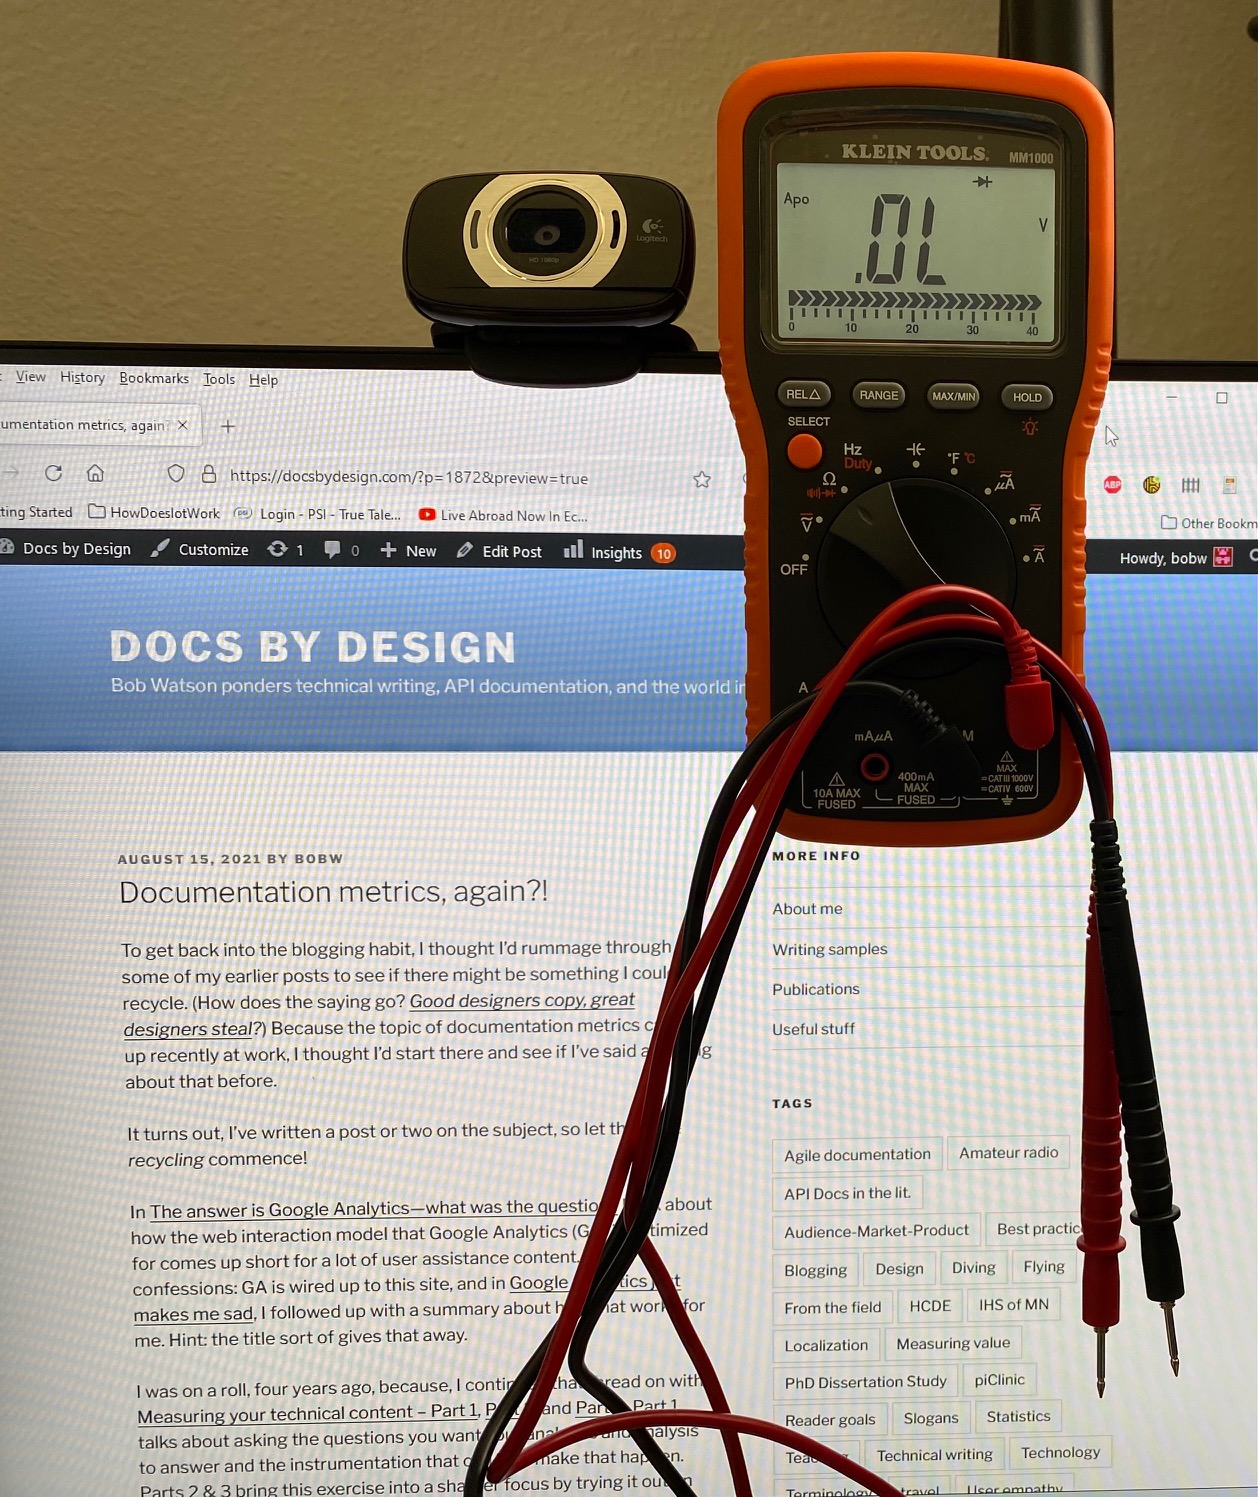
About the image
The image for this post is from a dream I had early in my career as a technical writer and continue to carry with me. The orange device is a digital multi-meter, which is used by electricians and electronics technicians to measure various electrical properties. To use it, you touch the test leads to the electrical circuit or component you’d like to measure, and it displays the value on the digital display. My dream is to have (or create!) a tool that would let you touch a web page with it, and have it display the measure you’re interested in.
One of these days…