
 That measuring API documentation is difficult is one of the things I’ve learned from writing developer docs for more than 11 years. Running the study for my dissertation gave me a detailed insight as to some of the reasons for this.
The first challenge to overcome is answering the question, “What do you want to measure?” A question that is followed immediately by, “…and under what conditions?” Valid and essential, but not simple, questions. Stepping back from that question, and a higher-level question comes into view, “What’s the goal?” …of the topic? …of the content set? and then back to the original question, of the measurement?
For my dissertation, I spent considerable effort scoping the experiment down to something manageable, measurable, and meaningful–ending up at the relevance decision. Clearly there is more to the API documentation experience than just deciding if a topic is relevant, but that’s a pivotal moment in the content experience. The relevance decision also seemed to be the most easily identifiable, discrete event that I could identify in the overall API reference topic experience. It’s a pivotal point in the experience, but by no mean the only one.
The processing model I used was based on the TRACE model presented by Rouet (2006). Similar cognitive-processing models were also identified in other API documentation and software development research papers. In this model, the experiment focuses on step 6.
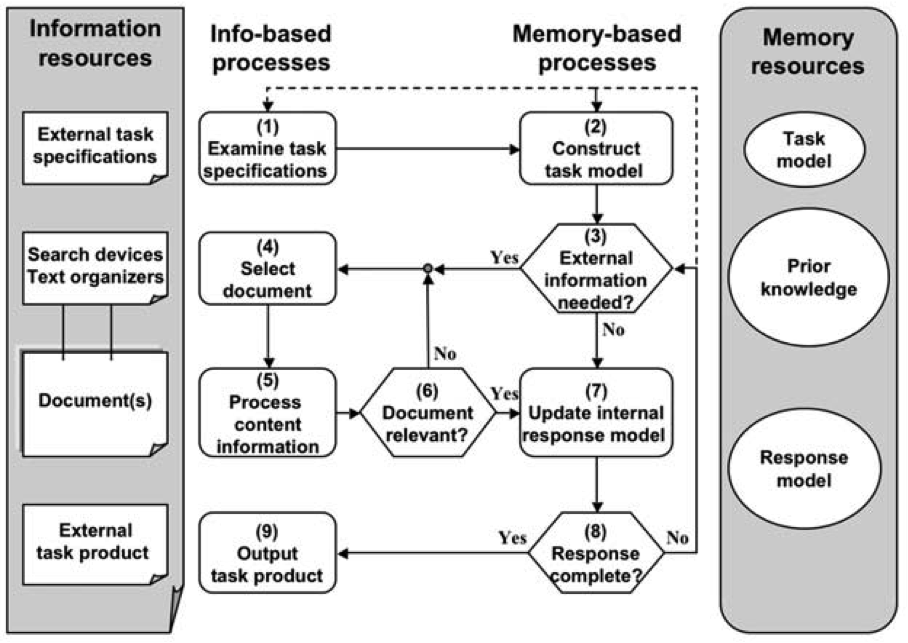
Rouet, J.-F. (2006). The Skills of Document Use: From Text Comprehension to Web-Based Learning (1st ed.). Lawrence Erlbaum Associates.
Even in this context, my experiment studies a very small part of the overall cognitive processing of a document and an even smaller part of the overall task of information gathering to solve a larger problem or to answer a specific question.
To wrap this up by returning to the original question, that is…what was the question?
- The goal of the topic is to provide information that can be easily accessible to the reader.
- The easily accessible goal is measured by the time it takes for the reader to identify whether the topic provides the information they seek or not.
- The experiment simulates the readers task by providing the test participants with programming scenarios in which to evaluate the topics
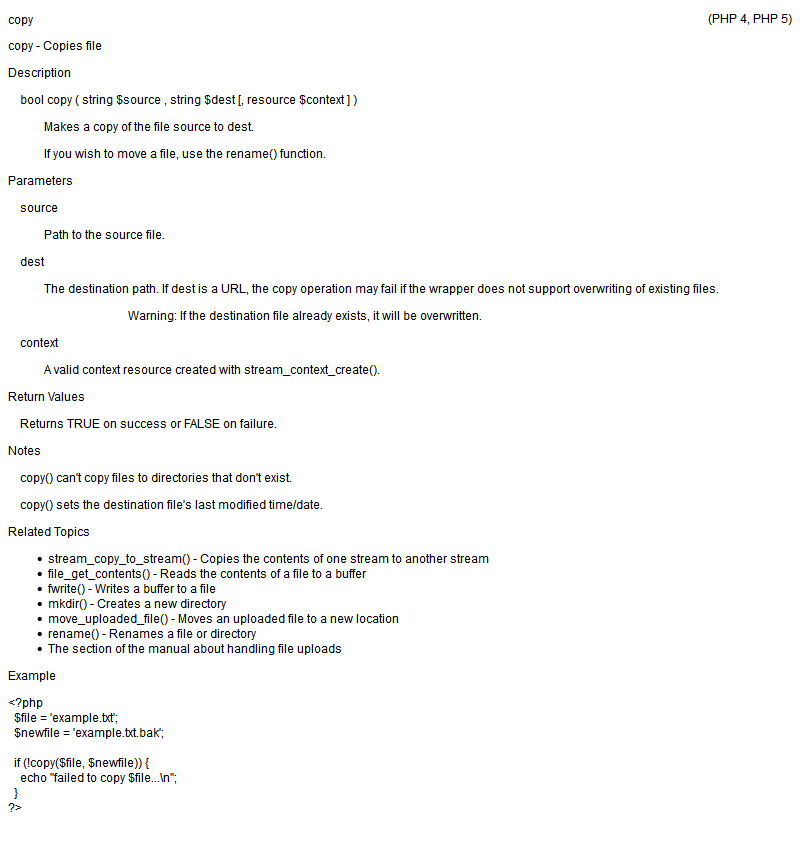
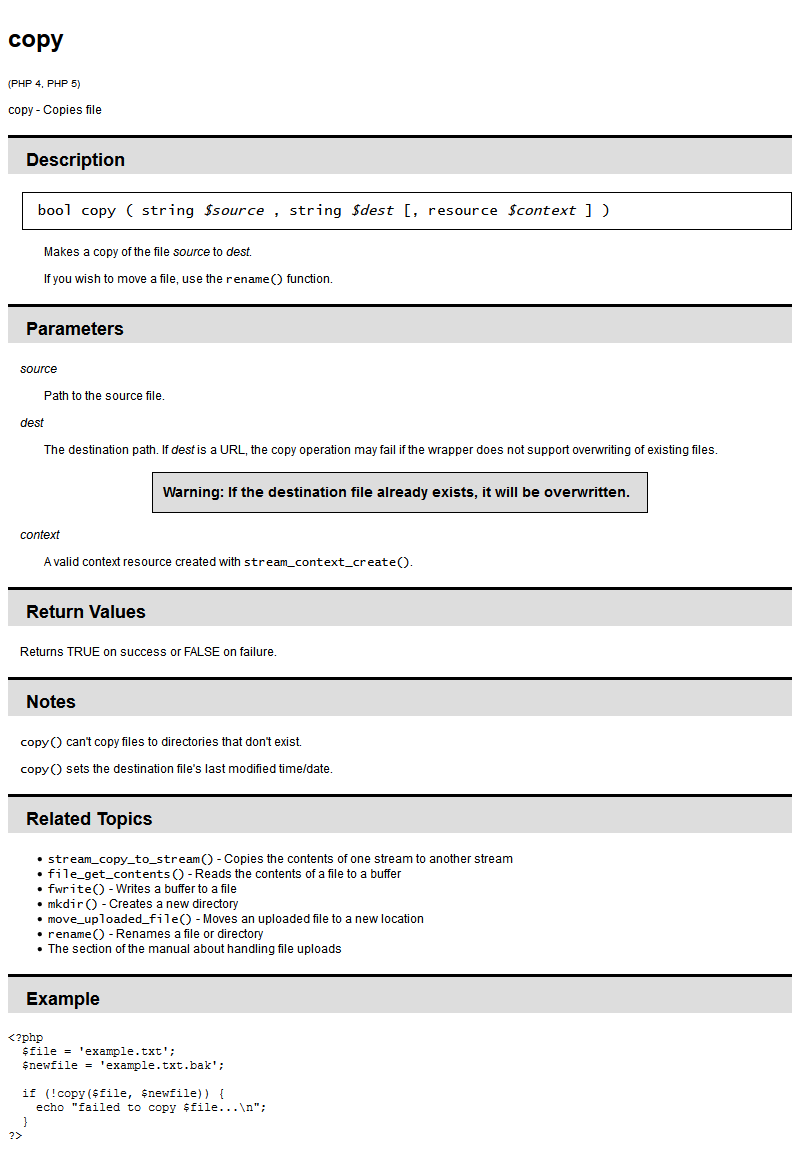
- The topics being studied are varied randomly to reduce order effects and bias and participants see only one version of the topics to bias their experience by seeing other variations.
In this experiment, other elements of the TRACE model are managed by or excluded from the task.

 [CC BY 2.0 (http://creativecommons.org/licenses/by/2.0)], via Wikimedia Commons")