
In my previous post, If it’s not statistically significant, is it useful? (and every grad-school class I taught statistics), I talked about staying within the limits of your data. By that, I mean not making statements that misrepresent what the data can support—basically, keeping it real.
Correlation is not causation
Perhaps the most common example of that is using correlation methods and statistics to make statements that imply causation. My favorite site for worst-case examples of correlations that would make for some curious assumptions of causation is Tyler Vigen’s Spurious Correlation site.
Here’s a fun example. This chart shows that the number of computer science doctorates awarded in the U.S. correlates quite highly with the total revenue generated by arcades from 2000 to 2009.
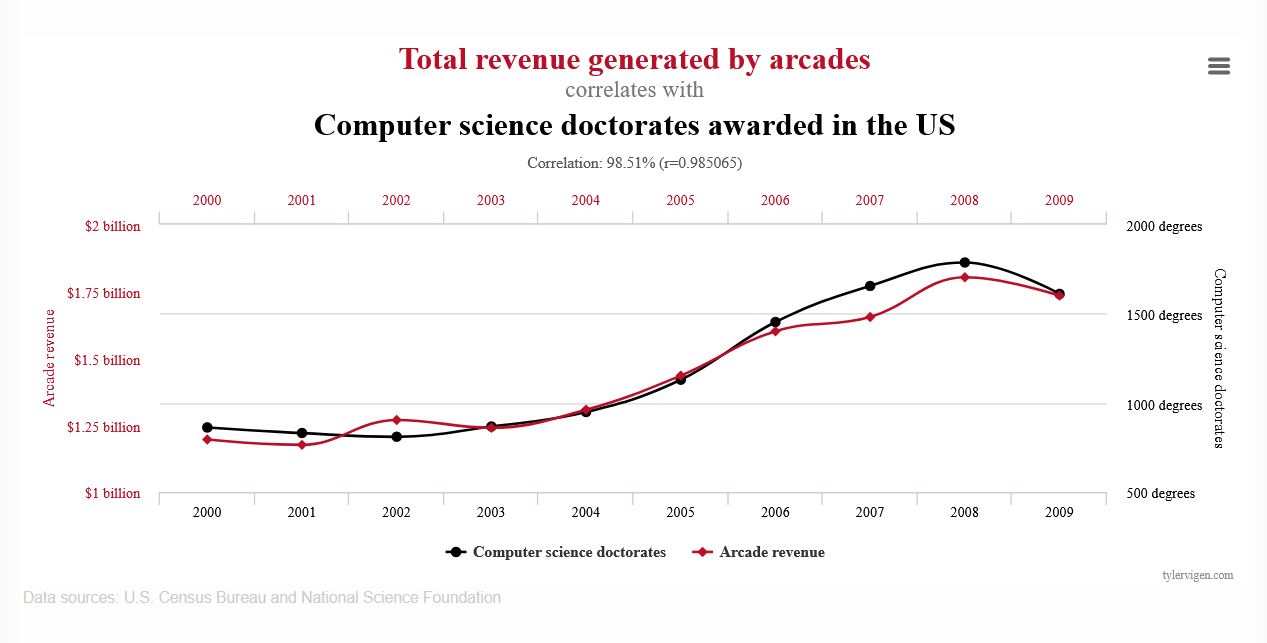
Does this chart say that computer science doctorates caused this revenue? No.
While it’s possible that computer science Ph.D. students contribute a lot of money to arcades or, perhaps, arcades were funding computer science Ph.D. students. The problem is that this chart, or more importantly, this type of comparison, can’t tell us whether either one is true or not. Based on this chart, to say that one of these factors is the cause of the other would be exceeding the limits of this chart.
Describe the data honestly
In my previous post, If it’s not statistically significant, is it useful?, I talk about how the sparse customer feedback in that example couldn’t represent the experience of all the people who looked at a page with a feedback prompt. The 0.03% feedback to page view rate and self-selection of who submitted feedback prevent generalization beyond the responses.
Let’s try an example
Imagine we have a site with the following data from the past year.
- 1,000,000 page views
- A feedback prompt on each page: “Did you find this page helpful?” with the possible answers (responses) being yes or no.
- 120 (40%) yes responses
- 180 (60%) no responses
What can we say about this data?
First the obvious, factual data:
- We received 300 feedback responses from the site with 1,000,000 page views
- We had a 0.03% response rate
- 40% of the responses reported that the page was helpful
- 60% of the responses reported that the page was not helpful
All of these statements are true and within the limits of the data and its collection methodology.
You might also say that you looked into some of the pages that received not helpful ratings and found some opportunities to improve them (assuming, of course, that you did this).
As a methodological assumption, I calculate the response rate from the page views because each view is an opportunity for a reader to respond to the prompt. Unfortunately, I don’t know if all responses came from a single reader or multiple readers.
What can’t we say about this data?
You can’t say anything about anything but the responses.
We can’t, for example, say anything about customers, because we don’t know if the respondents are customers, and even if we knew they were customers, perhaps they had to enter a customer ID to view the content, the survey methodology prevents us from knowing if their responses represent all customers, which is what a generalization like customers implies.
We can’t say anything about satisfaction because we didn’t ask them about their satisfaction. Sure, if they found the page helpful, they might be satisfied, but they might not be as well. The point is, we don’t know from this data.
We can’t say anything about their success because helpful is different from successful and we didn’t ask the readers anything about their success. In my posts about Reader Goals, I talk about how being successful and reading to achieve that success can be things that are separated by space and time.
Most importantly, what can we do with this data?
My previous post, If it’s not statistically significant, is it useful?, said that this feedback was good for identifying problems, and described a process to investigate further.
The feedback could be (and is likely) distributed across the content set. If each response was from a different page, we could generalize this data to describe the content set overall, but still can’t generalize the feedback to readers overall. We could report that our 40% of our content set was reported to be helpful by those that responded, for example.
Looking further into the responses, we might find that the responses cluster around certain pages or sections, which could direct your investigation to look for something systematic within that section.
Keeping it real
Although you’re collecting survey responses from the “Did you find this page helpful?” question, reporting the data in a way that implies that it applies to a group beyond the respondents, is misleading. However, the data is still worth collecting as it can be useful to help you improve the product and the documentation.