What did AI think of my recent article about AI?

In the process of writing A look at the past to see the future of technical writing, Adobe Acrobat’s AI assistant suggested that I ask it: Will AI completely replace human technical writers in the future?

What follows is the AI’s unedited 419-word answer to that question based on my 1,500-word article.


Based on the information provided in the document, it is unlikely that AI will completely replace human technical writers in the future. ​ Here are the reasons:

Continue reading “What did AI think of my recent article about AI?”

A look at the past to see the future of technical writing

Out of pure coincidence, I stumbled across this blog post about Technical writing in 2049 by Fabrizio Ferri Benedetti as I reviewed some examples of my earliest technical writing. I thought this might be a good opportunity to reflect on the past to see into the future.

My oldest artifact of technical writing that I authored is a technical manual for a central patient monitoring system I built for a hospital in 1981. The oldest technical manual I could find in my library is an Air Force training manual from 1952. I’ve kept some other relics of technical writing, but most are still in boxes.

Fabrizio’s blog post ends with this line, “What do you think tech writing will look like in 2049? I’d love to hear your predictions!” With my historical artifacts in hand, I accept his challenge and offer this response.

While I can only imagine what I thought about the future in years past, I can use these artifacts as examples of where technical writing has been and where it might go. I can also use them to describe how hard it is to predict the effects of a technical disruption, except by saying, “The more things change, the more they stay the same.”

Tech comm 1999

25 years ago, we still mostly printed the tech docs in books, as we had done in the decades that preceded, although online documentation was clearly about to make its debut. For a short while, CDs replaced printed docs but soon after, tech docs were almost exclusively served online. Could I have imagined online docs in 1999? Probably, without too much imagination. After all, we already had AltaVista.

To look at the past, present, and the future of technical writing, I think it’s best to tease that apart into content, production, and use or audience.

I’ll leave out stakeholders, because I haven’t seen that change much since content went online and the business model for technical writing all but disappeared. That’s a conversation for another article.

Continue reading “A look at the past to see the future of technical writing”

Tips for conducting documentation research on the cheap

In my previous post, I presented some experiences with testing and the resulting epiphanies. In this post, I talk more about the process I applied.

The process is simple, yet that’s what makes it difficult. The key to success is to take it slow.

The question

Start with something simple (and then simplify it). Your first questions will invariably be too big to answer all at once, so think, “baby steps.”

Instead of asking, “How can we improve our documents?” I asked, “What do users think of our table of contents (ToC)?” Most users don’t care about how we can improve our docs, unless they’re annoyingly bad, so they don’t give it much thought. They do, as we found out, use the ToC, and we learned that it wasn’t in a way that we could count.

The sample

Whoever you can get to sit with you. Try to ask people who are close to your target audience, if you can, but anyone who is not you or in your group is better than you when it comes to helping you learn things that will help you answer your question.

The process

Listen with a curious mind. After coming up with an answerable question, this is the next hardest thing to do—especially if people are reviewing something that you had a hand in writing or making.

Your participants will invariably misinterpret things and miss the “obvious.” You’ll need to suffer through this without [too much] prompting or cringing. Just remind yourself those moments are where the learning and discovery happen (after the injuries to egos and knees heal, anyway).

When the participant asks for help, such as, “where’s the button or link to do ‘X’?” A trick I learned from more experienced usability testers is to ask them, “where do you think it should be?” That way you learn something about the user experience, rather than just finishing the task without learning anything. If they’re still stumped, you can help them along, but only after you’ve learned something. Remember, you’re there to learn.

Continue reading “Tips for conducting documentation research on the cheap”

Documentation research requires more curiosity than money

Sure, money helps, but success doesn’t always correlate with dollars spent.

Here are a couple of examples that come to mind from my experience.

piClinic research

My favorite research success story (perhaps because it turned out well) occurred while I was researching the piClinic project. While on a medical mission to a rural clinic in Honduras, I saw a mountain of paper patient records with a lot of seemingly valuable information in them that could never be tapped. Clearly (to me) computerizing those records would improve things. I felt that, based on my first-hand experience, automating record storage would make it easier to store and retrieve the patient records.

It would, and later, it did.

But…

When I later actually sat down and interviewed the target users and watched what they did during the day and, more importantly, during the month, I learned that what I thought was their biggest obstacle, storage and retrieval, was not really a problem for them.

It turned out that the real time-consumer in their process was reporting the data to the regional health offices from these documents. Each month, each clinic would spend 2-3 days doing nothing but tabulating the activity of the clinic in their reports—something I hadn’t seen for myself in my earlier, more limited, experiences.

My assumption that storage was the problem to solve died during that research. So, I pivoted the design of the piClinic app to focus on reporting (as well as the storage and retrieval necessary to support that) to reduce their monthly reporting time from days to minutes.

Continue reading “Documentation research requires more curiosity than money”

Writing UI text—less is more, taken to the extreme

Less is more is a mantra frequently heard in technical writing. When applied to editing, this works out to be something like, “After writing, keep taking the words out until it stops making sense, then put the last word back in.”

While this approach applies to technical writing in general, it comes into sharp focus in user interface (UI) text where both time and space are in very short supply. The reader/user is often in a hurry and there’s no space to put any extra text.

The key to success with such approaches to minimalism is to know your audience. I’d like to share a couple of examples of knowing your audience and how this resulted in two different outcomes.

The examples

The first example is an interface from the piClinic research project I conducted from 2016-2019. In that project, I was trying to learn if limited-resource clinics in Honduras that used a paper-based records with no automation could successfully adopt a small-scale computerized record keeping system. This project was low budget in every dimension, but I’d researched the requirements thoroughly and felt like I understood the user well enough to design a system that would work for them. The field tests in 2019 confirmed that hypothesis.

The second example is from a recent update to the Amazon Web Services (AWS) Console interface that I worked on. In this project, I collaborated with a talented team of UX designers, program managers, and developers to update the interface and improve its usability. My role was primarily the text on the interface; however, the text, design, and implementation are all intertwined.

Compared to the piClinic, the AWS project had much more talent and support behind it. In retrospect, the budget certainly influenced the design and the implementation of each project, but the approach to crafting the words used (or not used) in each of the interfaces had a lot in common.

The text in both interfaces was designed to meet the target users where they are.

Continue reading “Writing UI text—less is more, taken to the extreme”

Proving and defending the value of technical writing, again

A red compact car with no tires or wheels propped up on bricks.

A couple of weeks ago, I responded to this post on LinkedIn in which Nick, the original poster, asked, as so many technical writers before him:

Does anyone have data from their industry, demonstrating why it’s important to have good documentation? I’m struggling to convince (some) product managers why we need to invest in this.
Thanks in advance!

Nick received lots of well-intentioned suggestions that could provide data and reason to support a response to the product manager. And then, I replied:

That’s not how documentation works.
Good documentation is what customers expect. Not having good docs, however, will cost you.
Maybe say, “let’s take the docs offline for a week and see what happens?” At the end of the week, you’ll have the data you need.

While my reply contains a dash of snark, it’s really the only way I could think of at the moment to shock the discussion back to something productive.

This type of prove your worth to me question isn’t really looking for data. It’s usually more to establish some sort of dominance or just to pick a fight (however politely). In the worst-case scenario, they’re looking for positions (other than theirs) to cut.

I find this question to be annoying, not just because I’ve been hearing this for decades, but because it presumes that documentation doesn’t have any worth until you prove it. The same question could be asked of the product manager: What data is there to demonstrate why we need good product management?

So, can we please move past the “why are you even here?” challenge? Can we assume, for the moment at least, that we’re all professionals and we’re all here to deliver the best value to the customer for the company?

Continue reading “Proving and defending the value of technical writing, again”

How to not suffer the curse of knowledge

Photo of Rodin's sculpture of The Thinker (Le Penseur)

Wikipedia says that the curse of knowledge “is a cognitive bias that occurs when an individual, who is communicating with other individuals, assumes that they have the background knowledge to understand.”

I’ve suffered that curse on various occasions, but I think I might have a way to reduce its frequency.

Know your audience.

Thank you for visiting.

Just kidding. There’s more.

Knowing your audience is one of the first things we teach technical writers, but that advice doesn’t quite address the nuance required to vaccinate yourself against the curse of knowledge.

Here are few steps I’ve used.

Step 1. Empathize with your audience

It’s more than just knowing them; it’s understanding them in the context of reading your content. This interaction might be minor in your reader’s experience, but it’s the reason you’re writing technical documentation. It’s extremely helpful to understand your readers in the moments of their life in which they’re reading your documentation.

Know why they’ll be reading your documentation or even just a topic in your documentation. What brings them to that page? What’s their environment like? What pressures are they under? What are their immediate and long-term goals? What would they rather be doing instead of reading your doc?

The reality is that most readers would rather be doing almost anything else but reading technical documentation—so, how can you work with that (besides not writing it)?

Continue reading “How to not suffer the curse of knowledge”

Reporting documentation feedback and keeping it real

Chart showing a high correlation between Comp Sci PHDs and Arcade revenue

In my previous post, If it’s not statistically significant, is it useful? (and every grad-school class I taught statistics), I talked about staying within the limits of your data. By that, I mean not making statements that misrepresent what the data can support—basically, keeping it real.

Correlation is not causation

Perhaps the most common example of that is using correlation methods and statistics to make statements that imply causation. My favorite site for worst-case examples of correlations that would make for some curious assumptions of causation is Tyler Vigen’s Spurious Correlation site.

Here’s a fun example. This chart shows that the number of computer science doctorates awarded in the U.S. correlates quite highly with the total revenue generated by arcades from 2000 to 2009.

Chart showing a high correlation between Comp Sci PHDs and Arcade revenue
An example of the crazy correlations found at https://www.tylervigen.com/spurious-correlations

Does this chart say that computer science doctorates caused this revenue? No.

While it’s possible that computer science Ph.D. students contribute a lot of money to arcades or, perhaps, arcades were funding computer science Ph.D. students. The problem is that this chart, or more importantly, this type of comparison, can’t tell us whether either one is true or not. Based on this chart, to say that one of these factors is the cause of the other would be exceeding the limits of this chart.

Describe the data honestly

In my previous post, If it’s not statistically significant, is it useful?, I talk about how the sparse customer feedback in that example couldn’t represent the experience of all the people who looked at a page with a feedback prompt. The 0.03% feedback to page view rate and self-selection of who submitted feedback prevent generalization beyond the responses.

Let’s try an example

Imagine we have a site with the following data from the past year.

  • 1,000,000 page views
  • A feedback prompt on each page: “Did you find this page helpful?” with the possible answers (responses) being yes or no.
  • 120 (40%) yes responses
  • 180 (60%) no responses

What can we say about this data?

Continue reading “Reporting documentation feedback and keeping it real”

If it’s not statistically significant, is it useful?

A compressed view of traffic in downtown Seattle with cars, buses, and pedestrians from 1975

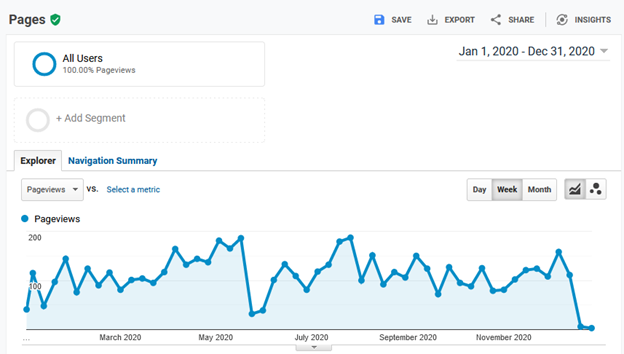
In all the product documentation projects I’ve worked on, a good feedback response rate to our help content has been about 3-4 binary (yes/no) feedback responses per 10,000 page views. That’s 0.03% to 0.04% of page views. A typical response rate has often been more like half of that. Written feedback has typically been about 1/10 of that. A frequent complaint about such data is that it’s not statistically significant or that it’s not representative.

That might be true, but is it useful for decision making?

Time for a short story

Imagine someone standing on a busy street corner. They’re waiting for the light to change to cross the street. It’s taking forever and they’re losing patience. They decide to cross. The person next to them sees that they’re about to cross, taps them on the shoulder, and says, “the light’s still red and the traffic hasn’t stopped.” Our impatient pedestrian points out, “that’s just one person’s opinion,” and charges into the crossing traffic.

Our pedestrian was right. There were hundreds of other people who said nothing. Why would anyone listen to just that one voice? If this information were so important, wouldn’t others, perhaps even a representative sample of the population, have said something?

Not necessarily. The rest of the crowd probably didn’t give it any thought. They had other things on their mind at the time and, if they had given it any thought at all, they likely didn’t think anyone would even consider the idea of crossing against the traffic. The crossing traffic was obvious to everyone but our impatient pedestrian.

Our poor pedestrian was lucky that even one person thought to tell them about the traffic. Was that one piece of information representative of the population? We can’t know that from this story. Could it have been useful? Clearly.

Such is the case when you’re looking at sparse customer feedback, such as you likely get from your product documentation or support site.

A self-selected sample of 0.03% is likely to be quite biased and not representative of all the readers (the population).

What you should consider, however, is: does it matter if the data is representative of the population? Representative or not, it’s still data—it’s literally the voice of the customer.

Let’s take a closer look at it before we dismiss it.

Understanding the limits of your data

Let’s consider what that one person at the corner or that 0.03% of the page views tell us.

  • They don’t tell us what the population thinks. By not being statistically representative, we can’t generalize such sparse data to make assumptions about the entire population.
  • The do tell us what the they think. We might not know what the population thought, but we know that 0.03% thinks.

The key to working with data is to not go beyond its limits. We know that this sparse data tells us what 0.03% of the readers thought, so what can we do with that?

Continue reading “If it’s not statistically significant, is it useful?”

You’ve tamed your analytics! Now what?

In my last post, I talked about How you can make sense of your site analytics. But once you make sense of them, what can you do with them?

Let’s say that you’ve applied that method and you can now tell the information from the noise, what’s next?

The goal of the method presented in the last post is mostly to separate the information from the noise so you can make information-based decisions as opposed to noise-based decisions.

There are a couple of things you’re ready to do.

  • Reduce the noise
  • Improve the signal

They’re not mutually exclusive, but you might find it easier to pick one at a time to work on.

Let’s talk about the noise, first.

Why is it noisy?

Recall this graph of my site’s 2020 page views.

Graph of DocsByDesign.com website traffic for 2020 showing a lot of variation.
DocsByDesign.com website traffic for 2020

During 2020, I only made one post about how I migrated my site to a self-hosted AWS server. Not a particularly compelling article but, it’s what I had to say at the time—and apparently all I really had to say for 2020.

Based on that, this is a graph of the traffic my site sees during the year while I ignore it. It’s a graph of the people who visit my site for whatever reason—and therein lies the noise. People, or at least the people who visited my site in 2020, visited for all kinds of reasons—all reasons but my tending to the site.

Let’s see if we can guess who these visitors might be. Here’s a table of my site’s ten most visited pages during 2020.

Continue reading “You’ve tamed your analytics! Now what?”